
In this article
- Why most streaming metrics mislead
- The core OTT KPIs at a glance
- ARPU for streaming services
- Churn: the KPI that decides your future
- Voluntary and involuntary churn
- LTV and CAC for streaming
- Retention and watch time analytics
- Engagement metrics worth tracking
- Turning OTT KPIs into action
- Key takeaways
- Frequently asked questions
- What are the most important OTT KPIs?
- What is a good churn rate for a streaming service?
- How do I calculate LTV for a streaming app?
- Why does watch time matter if I sell subscriptions?
Streaming dashboards can show hundreds of numbers. Most of them do not tell you whether the business is healthy. The OTT KPIs that matter are the ones that link viewer behaviour to revenue: how much viewers pay, how long they stay, how much they watch and what it costs to win them.
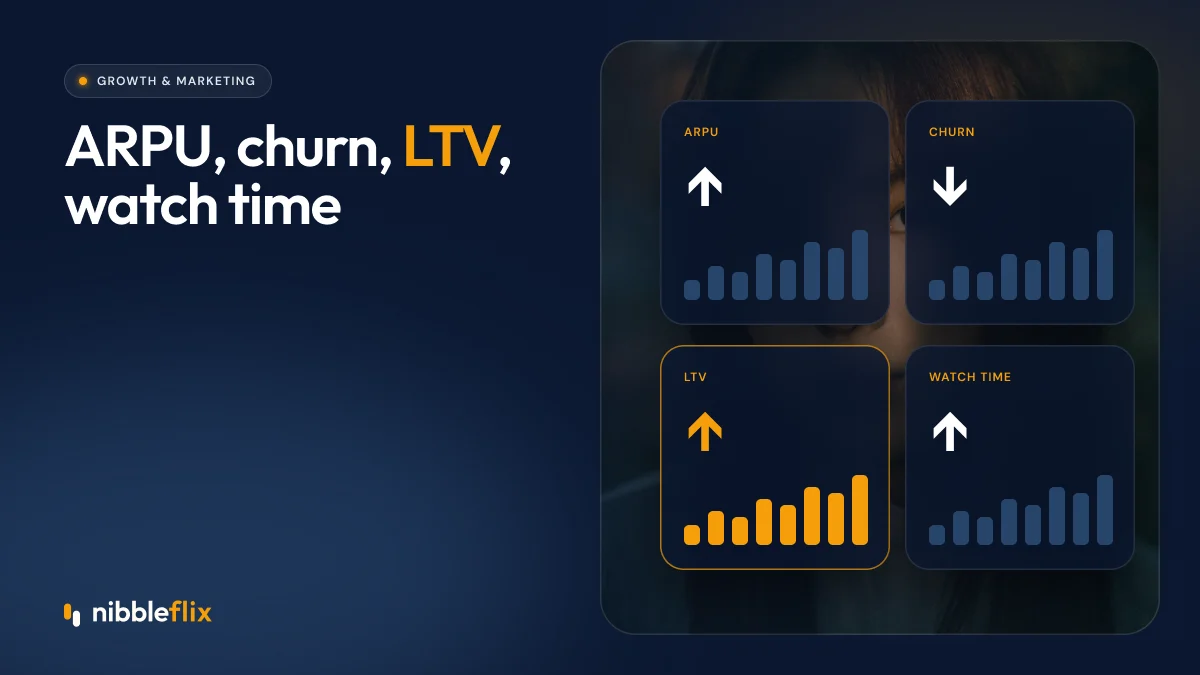
The short answer: the core OTT KPIs are ARPU, churn, lifetime value (LTV), customer acquisition cost (CAC), cohort retention and watch time, because together they tell you whether growth is profitable and sustainable.
This guide explains each one, how to calculate it and what to do when it moves.
Why most streaming metrics mislead
Installs, registered users and total views are easy to grow and easy to celebrate. But a service can double installs while losing money if new viewers leave after one session. The best streaming metrics measure value and loyalty, not just volume.
Think of your KPIs as a chain: acquisition brings viewers in, engagement keeps them watching, monetization turns watching into revenue, and retention keeps that revenue coming.
The core OTT KPIs at a glance
| KPI | Simple formula | What it tells you |
|---|---|---|
| ARPU | Revenue in period / active users | How much each viewer is worth per month |
| Churn | Subscribers lost in period / subscribers at start | How fast you lose paying viewers |
| LTV | ARPU x gross margin / monthly churn | Total value of a typical viewer |
| CAC | Marketing spend / new paying viewers | Cost to win one paying viewer |
| Retention | Share of a cohort still active on day N | Whether viewers form a habit |
| Watch time | Minutes watched per active viewer per day | How engaged viewers are |
ARPU for streaming services
ARPU (average revenue per user) shows how well you monetize your audience. For streaming, it pays to track it two ways: per paying subscriber and per monthly active user, including free and ad-supported viewers.
Benchmarks vary hugely by region. Adjust data reported by PPC Land shows short drama revenue per monthly active user of $1.45 in APAC, compared with $0.43 in MENA. That is why the same model can be priced very differently across markets.
Ways to raise ARPU include annual plans, premium tiers, hybrid models that add ads or coins, and pay-per-episode for new releases. Our hybrid monetization guide covers combinations that work.
Churn: the KPI that decides your future
Churn is the share of paying viewers who cancel or stop paying in a period. Small differences add up quickly. A service losing 5% of subscribers a month keeps far fewer after a year than one losing 3%.
Voluntary and involuntary churn
- Voluntary churn: the viewer chooses to cancel, usually because they finished a series or lost interest.
- Involuntary churn: a payment fails. Retrying cards and reminding viewers can recover much of this.
Track churn by plan, country, acquisition channel and the content that brought viewers in. Our guide on how to reduce churn covers practical fixes.
LTV and CAC for streaming
Lifetime value tells you how much a typical viewer is worth over their whole relationship with you. For example, a viewer paying US$6 a month with 80% gross margin and 5% monthly churn is worth about US$96.
LTV only matters when compared with CAC. If it costs US$40 to win a paying viewer worth US$96, the ratio is healthy. If it costs US$120, every new subscriber loses money. A common rule of thumb is to aim for LTV at least three times CAC, and to recover CAC within a reasonable number of months.
Calculate LTV and CAC by channel. Social video ads, influencers, app store search and partnerships often bring very different viewers.
Retention and watch time analytics
Retention shows whether viewers come back. Track cohorts by install or sign-up date and measure the share still active on day 1, day 7 and day 30. Retention curves that flatten mean you are building a habit.
Short drama benchmarks show how tough this is. Adjust data reported by PPC Land puts global short drama retention at 15% on day 1 and 2% on day 30, with Latin America higher at 20% and 4%.
Watch time analytics add depth. Sensor Tower found average daily time in short drama apps reached 25 minutes by April 2026, while OTT apps stayed flat at about 35 minutes. Watch time per active viewer is often the earliest warning of churn: viewers who watch less are likely to cancel at renewal.
Engagement metrics worth tracking
- Minutes watched per active viewer per day.
- Episodes per session and series completion rate.
- Time from install to first play.
- Push alert open rate for new episodes.
- Daily check-in reward participation.
Turning OTT KPIs into action
A weekly KPI review should lead to decisions, not just reports. Match each problem to a lever:
- Low day 1 retention: shorten time to first play and make the first episode free.
- Falling watch time: schedule releases more often and send new-episode push alerts.
- High churn after one month: promote annual plans and next-series recommendations.
- Low ARPU: add ads, coins or a premium tier.
- Rising CAC: improve store listings and shift spend to channels with better LTV.
NibbleFlix gives you one admin dashboard for every app, where you upload episodes, set prices, schedule releases and see earnings without code. Retention tools such as daily check-in rewards and new-episode push alerts are built in. Learn more about the CMS and dashboard and the full platform features.
Key takeaways
- Track OTT KPIs that link behaviour to revenue: ARPU, churn, LTV, CAC, retention and watch time.
- Measure ARPU per payer and per active user, and compare by region.
- Split churn into voluntary and involuntary, and fix payment failures first.
- Aim for LTV well above CAC, measured by acquisition channel.
- Use watch time as an early warning signal for churn.
Want a dashboard that shows earnings across every app in one place? Book a demo and see it live.
Frequently asked questions
What are the most important OTT KPIs?
Start with ARPU, churn, customer lifetime value, customer acquisition cost, retention by cohort and watch time. Together they show how much each viewer pays, how long they stay and how much it costs to win them. Installs and registered users are useful context but do not predict revenue on their own.
What is a good churn rate for a streaming service?
It depends on your model, price and content. Monthly subscription services often see several percent of subscribers cancel each month, while annual plans churn far less. Compare yourself against your own history and cohorts rather than a single industry number, and focus on improving month by month.
How do I calculate LTV for a streaming app?
A simple version is average monthly revenue per user multiplied by gross margin, divided by monthly churn. For example, a viewer paying US$6 a month with 80% margin and 5% monthly churn has an LTV of about US$96. Use cohort data once you have it, since it is more accurate.
Why does watch time matter if I sell subscriptions?
Watch time is an early warning signal. Viewers who watch less are much more likely to cancel at their next renewal. Tracking watch time by viewer and cohort lets you spot falling engagement before churn appears in your revenue, and act with new releases, push alerts or offers.